About WDB Group
History of WDB Group
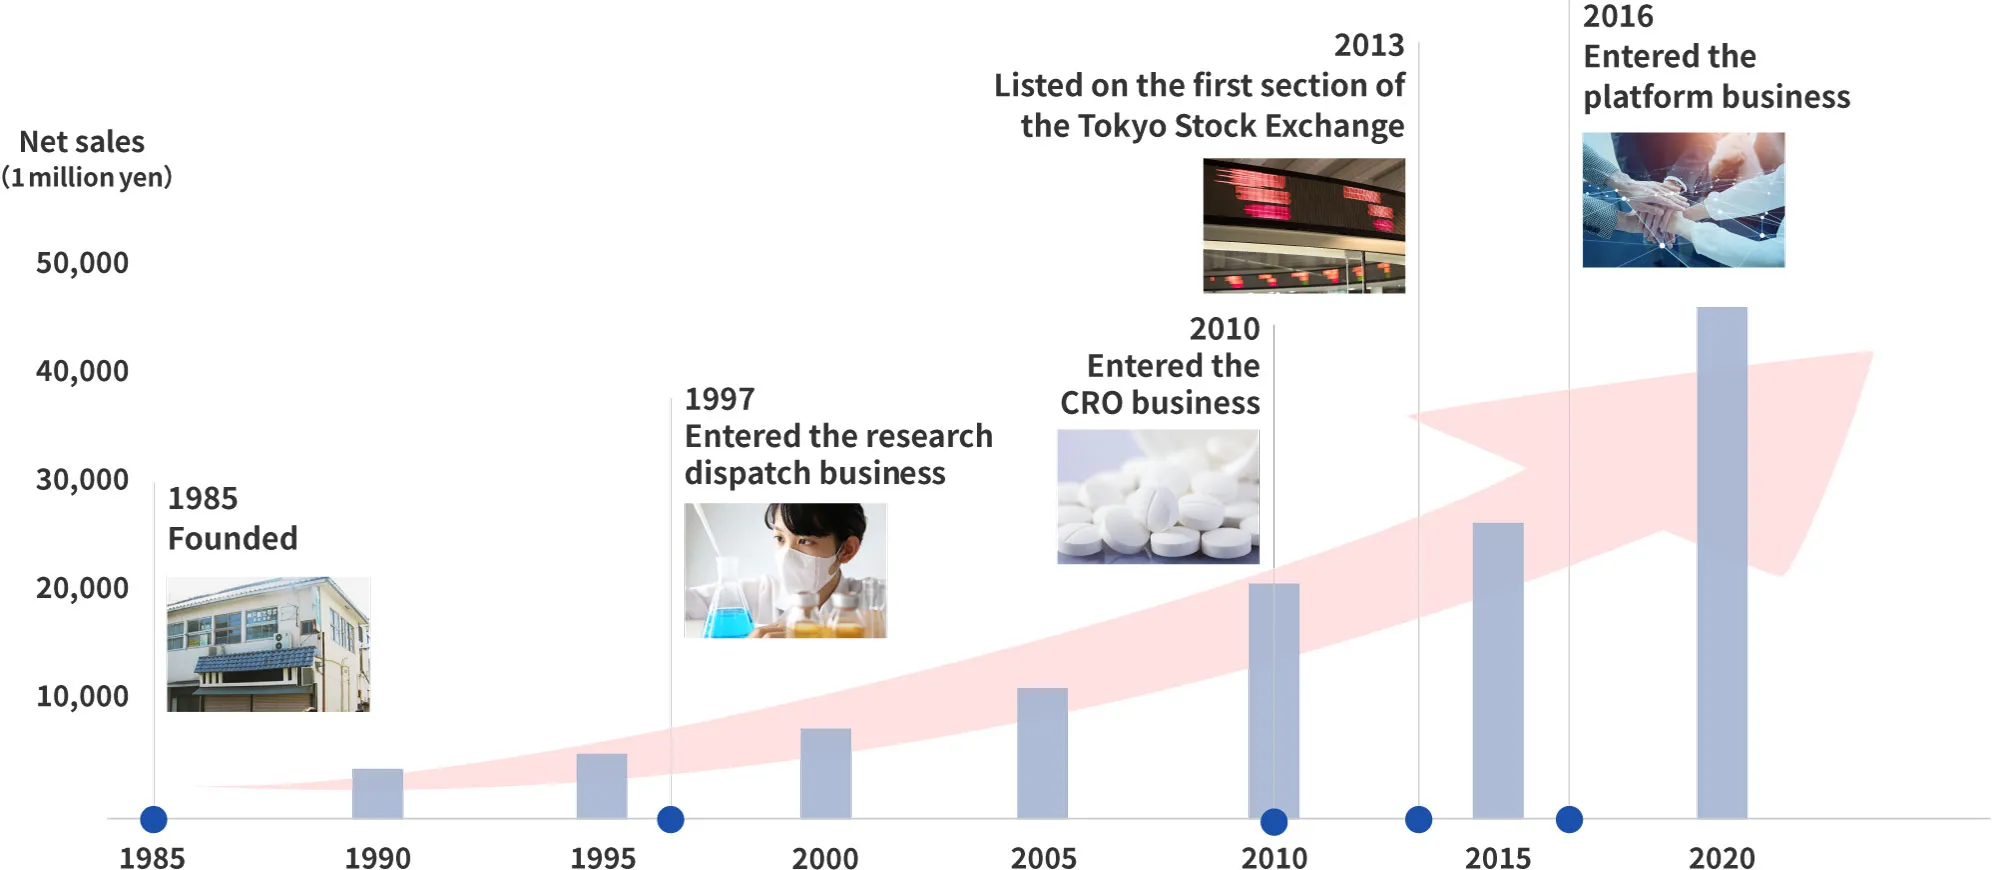
※WDB Holdings Co., Ltd moved from the First Section of Tokyo Stock Exchange to the Prime Market of Tokyo Stock Exchange.
Businesses of WDB Group
The WDB Group has four businesses: human resource business, CRO business, platform business and other business.
-

Human resource business
WDB Co., Ltd., EUREKA Company, KOUGAKU Company
-

CRO business
WDB coco Co., Ltd., Cobridge Co., Ltd., Oy Medfiles Ltd.
-

Platform business
NEZOT Co., Ltd., DOCO1 Co., Ltd.
-

Other business
WDB Business Succession Partners Co., Ltd., WDB Doppo Co., Ltd. (Promotion of Employment of The Disabled)
WDB Group by the numbers
Business performance
-
Net sales
50.3billion yen
-
Ordinary income
4.5billion yen
Net sales of WDB Group in the fiscal year ended in March 2026 is 50.3 billion yen.
Shareholder return
-
Dividend payout ratio (Term March 2027 Forecast)
65.1%
Beginning with the fiscal year ending March 2027, we will target a dividend payout ratio of 65% and pursue sustainable dividend growth through continued business growth.
Strengths of human resources business
-
Share of phisical science research field
1/3
-
Number of customers
About1,600clients
The human resources service business that we worked on for many years since its formation.
A share of the science researcher dispatch grew up to 1/3 now. Currently, the number of the business partners is about 1,600 clients.
WDB Group from now on
Promote DX and evolve business with the power of technology

WDB Holdings promote DX (digital transformation) and make a difference in the old-fashioned industry.
Regardless of existing business areas,
we will pursue infinite possibilities, evolve with technology, and open up a bright tomorrow.