Financial highlights
Our approach to business performance
Sales and profit growth and profit margins
Profitability and growth
We place primary importance on the sustainable growth of profit. While revenue growth is also essential, it is not our ultimate goal.
We focus on the operating profit margin as our primary profitability metric, targeting a benchmark of 10%. We aim to improve our gross profit margin by providing high value-added services and lower our SG & A expense ratio through efficient operations. The resources generated through the efforts are reinvested in human capital and system infrastructure, essential for continued growth.
Rather than focusing solely on profitability or growth, we aim to consistently achieve both of an operating profit margin of 10% and a net sales growth rate of over 10%.
Depending on the growth phase, we prioritize sales growth at the expense of profitability or accept slower growth to maintain margins. However, by flexibly adjusting our strategies in line with each growth phase, we will strive to balance profitability and growth while maximizing our corporate value.
![]() Operating Income
Operating Income
![]() Operating Income Rate
Operating Income Rate
Profitability and capital cost
We are committed to sustainably maintaining and improving ROE and ROIC through profit growth.
At present, both indicators are showing a downward trend, as we have prioritized raising temporary staff's compensation ahead of client billing rates with the aim of securing job seekers. However, we aim to improve these indicators going forward and to maximize the spread over our weighted average cost of capital (WACC), thereby ensuring returns that exceed our capital cost.
We do not intend to improve these indicators by reducing net assets, as we believe such an approach does not contribute to genuine corporate value.

Consolidated financial figures
| Period | 41th Fiscal Year | 40th Fiscal Year | 39th Fiscal Year | 38th Fiscal Year | 37th Fiscal Year |
|---|---|---|---|---|---|
| Fiscal Year | FY2025 | FY2024 | FY2023 | FY2022 | FY2021 |
| Net Sales(In-house Research & Development Staff on Science)(million yen) | 50,304 (34,305) |
51,136 (34,073) |
49,297 (33,485) |
47,602 (32,173) |
46,875 (31,523) |
| Gross Margin(million yen) | 11,576 | 11,742 | 11,889 | 11,934 | 12,492 |
| Operating Income(million yen) | |||||
| Ordinary Income(million yen) | 4,597 | 5,095 | 5,505 | 5,614 | 6,393 |
| Ordinary Income Rate(%) | 9.1 | 10.0 | 11.2 | 11.8 | 13.6 |
| Net Income Attributable to Owners of The Parent Company(million yen) | 2,755 | 3,051 | 3,548 | 3,540 | 4,171 |
| Net Assets Amount(million yen) | 34,306 | 33,241 | 31,150 | 28,463 | 25,796 |
| Total Assets(million yen) | 42,424 | 41,753 | 39,827 | 36,198 | 33,828 |
| Operating Cash Flow(million yen) | 2,793 | 4,367 | 4,494 | 3,553 | 4,025 |
| Investment Cash Flow(million yen) | - 3,943 | - 3,334 | - 713 | - 337 | - 6,104 |
| Financial Cash Flow(million yen) | - 2,071 | - 1,419 | - 1,240 | - 1,307 | - 870 |
| Capital to Asset Ratio(%) | 77.3 | 76.4 | 75.4 | 76.3 | 74.2 |
| Quick Ratio (%) | 359.4 | 389.6 | 383.7 | 394.6 | 342.5 |
| Fixed Ratio (%) | 53.4 | 45.0 | 37.2 | 38.9 | 42.7 |
| ROE (Return on Equity)(%) | 8.5 | 9.9 | 12.3 | 13.4 | 17.8 |
| ROA (Return on Assets)(%) | 6.5 | 7.5 | 9.3 | 10.1 | 12.9 |
| ROIC (Return On Invested Capital)(%) | 9.5 | 11.4 | 13.2 | 14.5 | 18.6 |
| WACC(Weighted Average Cost of Capital)(%) | 3.5 | 4.4 | 5.0 | 5.7 | 6.1 |
| Closing Market Price(yen) | 1,527 | 1,849 | 2,316 | 1,986 | 2,716 |
| BPS (Net Assets / 1 Share)(million yen) | 1,709.5 | 1,624.0 | 1,529.8 | 1,405.7 | 1,272.3 |
| P/B (Price Book-value Ratio) | 0.9 | 1.1 | 1.5 | 1.4 | 2.1 |
| Market Capitalization(million yen) | 30,631 | 37,090 | 46,458 | 39,839 | 54,482 |
| EPS (Current Net Income / 1 Share)(yen) | 141.6 | 155.3 | 180.6 | 179.8 | 211.3 |
| P/E (Price Earnings Ratio) | 10.8 | 11.9 | 12.8 | 11.0 | 12.9 |
| Dividend / 1 Share(yen) | 62.5 | 62.5 | 72.5 | 51.5 | 49.5 |
| Dividend / Total(million yen) | 1,210 | 1,227 | 1,423 | 1,013 | 977 |
| Dividend Payout Ratio(%) | 44.1 | 40.2 | 40.1 | 28.7 | 23.4 |
| Dividend Yield(%) | 4.1 | 3.4 | 3.1 | 2.6 | 1.8 |
| DOE (Dividend on Equity Ratio)(%) | 3.7 | 4.0 | 4.9 | 3.8 | 4.2 |
Net Sales
![]() Net Sales
Net Sales
![]() R&D Staff on Science
R&D Staff on Science
Gross Margin
![]() Gross Margin
Gross Margin
![]() Gross Profit Margin
Gross Profit Margin
Operating Income
![]() Operating Income
Operating Income
![]() Operating Income Rate
Operating Income Rate
Ordinary Income
![]() Ordinary Income
Ordinary Income
![]() Ordinary Income Rate
Ordinary Income Rate
Net Income Attributable to Owners of The Parent Company
![]() Net Income Attributable to Owners of The Parent Company
Net Income Attributable to Owners of The Parent Company
![]() Net Profit Margin
Net Profit Margin
ROE (Return on Equity)
![]() ROE (Return on Equity)
ROE (Return on Equity)
ROA (Return on Assets)
![]() ROA (Return on Assets)
ROA (Return on Assets)
ROIC (Return On Invested Capital)
![]() ROIC (Return On Invested Capital)
ROIC (Return On Invested Capital)
Capital to Asset Ratio
![]() Capital to Asset Ratio
Capital to Asset Ratio
Quick Ratio
![]() Quick Ratio
Quick Ratio
Fixed Ratio
![]() Fixed Ratio
Fixed Ratio
Total Assets
![]() Total Assets
Total Assets
Net Assets Amount
![]() Net Assets Amount
Net Assets Amount
BPS (Net Assets / 1 Share),EPS (Current Net Income / 1 Share)
![]() BPS (Net Assets / 1 Share)
BPS (Net Assets / 1 Share)
![]() EPS (Current Net Income / 1 Share)
EPS (Current Net Income / 1 Share)
P/E (Price Earnings Ratio), P/B (Price Book-value Ratio)
![]() P/E (Price Earnings Ratio)
P/E (Price Earnings Ratio)
![]() P/B (Price Book-value Ratio)
P/B (Price Book-value Ratio)
※YE:Year-End
Dividend / 1 Share
![]() Mid-term
Mid-term
![]() Term-end
Term-end
※ *:Forecast
Dividend / Total
![]() Dividend / Total
Dividend / Total
※ *:Forecast
Dividend Payout Ratio, Dividend Yield
![]() Dividend Payout Ratio
Dividend Payout Ratio
![]() Dividend Yield
Dividend Yield
※ *:Forecast
Market Capitalization, Closing Market Price
![]() Market Capitalization
Market Capitalization
![]() Closing Market Price
Closing Market Price
※YE:Year-End
DOE (Dividend on Equity Ratio)
![]() DOE (Dividend on Equity Ratio)
DOE (Dividend on Equity Ratio)
※ *:Forecast
Various Indicators from Listing (2006) to The Present
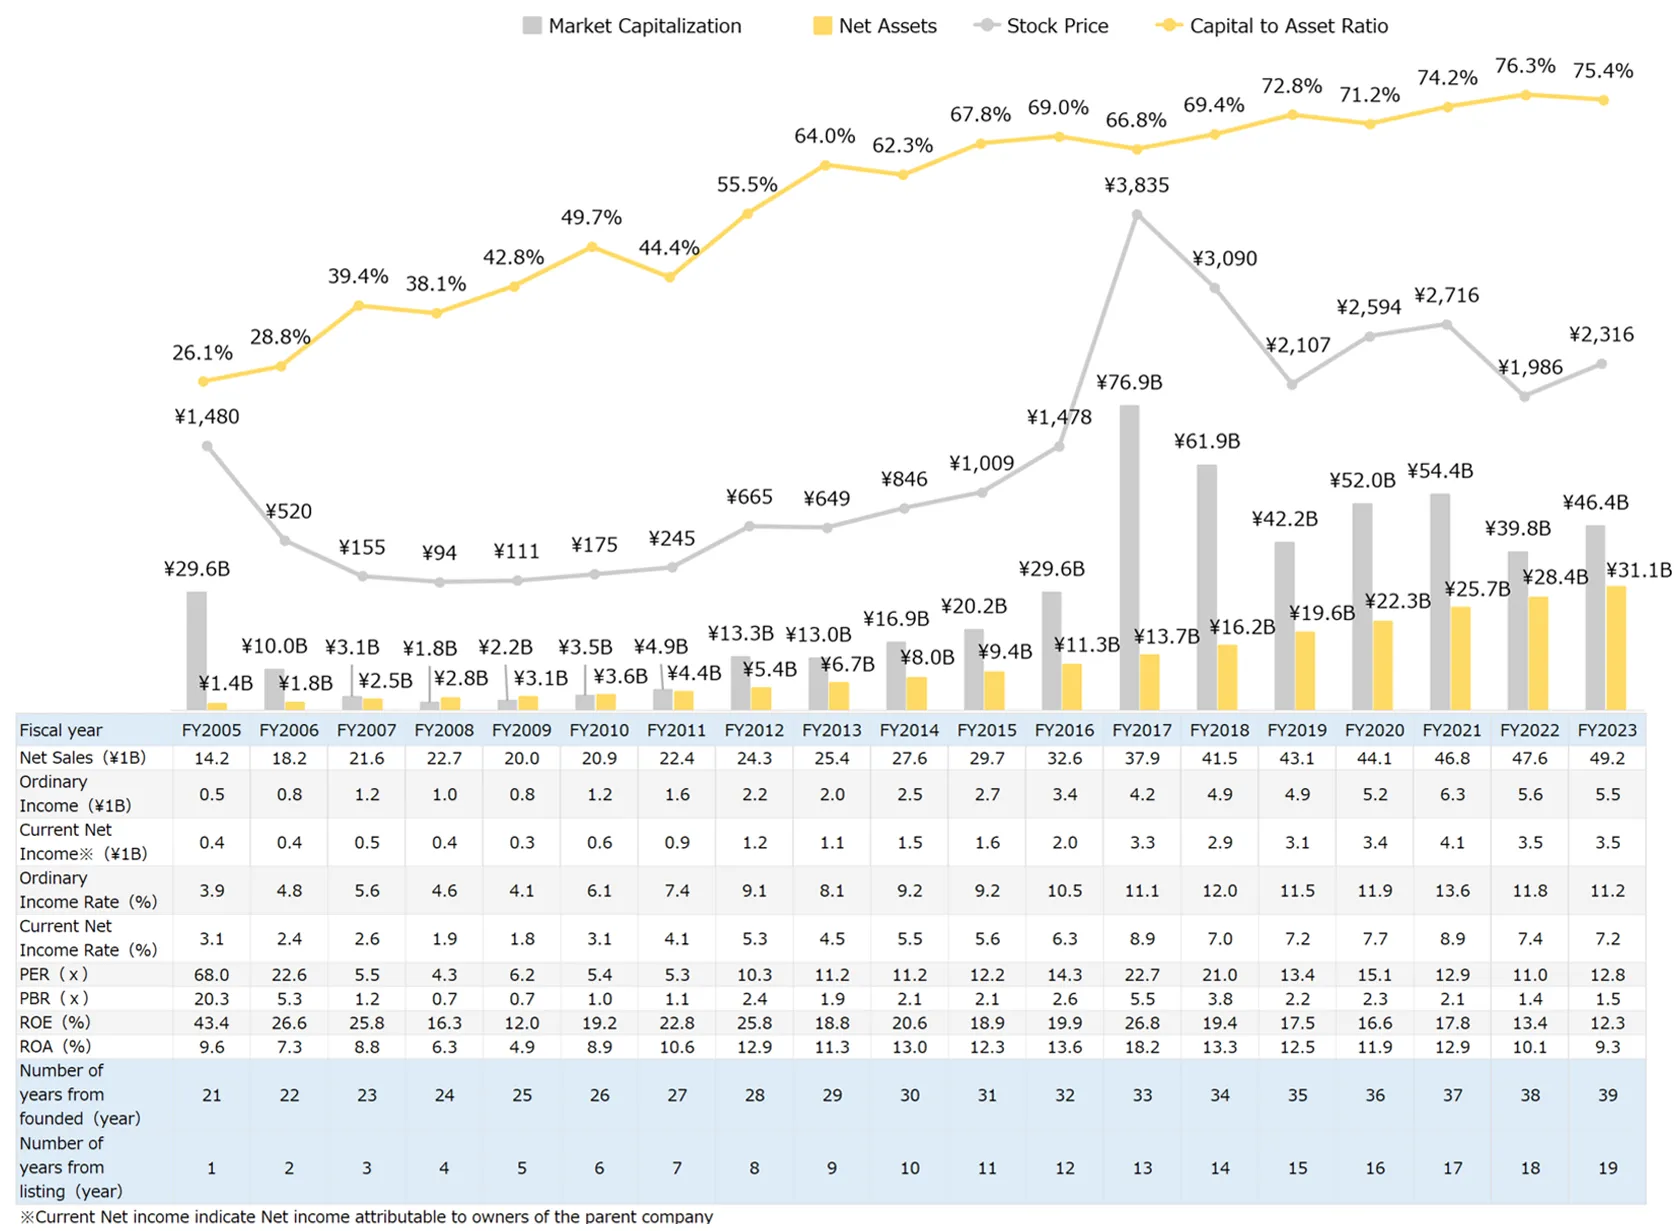
Market Capitalization, Stock Price, PER (Price Earnings Ratio)
![]() Market Capitalization
Market Capitalization
![]() Stock Price
Stock Price
![]() PER (Price Earnings Ratio)
PER (Price Earnings Ratio)
Please refer to the following page for further information, click here (price information page on Yahoo Finance).
Actual results against projected figures
Net Sales
![]() Plan
Plan
![]() Result
Result
![]() Achievement Rate
Achievement Rate
Gross Margin
![]() Plan
Plan
![]() Result
Result
![]() Achievement Rate
Achievement Rate
Ordinary Income
![]() Plan
Plan
![]() Result
Result
![]() Achievement Rate
Achievement Rate
Net Income Attributable to Owners of the Parent Company
![]() Plan
Plan
![]() Result
Result
![]() Achievement Rate
Achievement Rate